How to debug in a deployed operator
If you test a pipeline, then usually you would do it locally with the local Operator-/PipelineExecutor. However, there are cases, where the pipeline works fine locally, but behaves strange, if deployed e.g., it is running, but seems to be stuck somewhere. Although there is no remote debugging capability integrated into pypz yet, it is still possible to step into the code via GDB.
There are currently 2 python base images for pypz:
pypz-python-alpine (default in the template project), which contains only the necessary libs that is required by pypz, everything else needs to be installed by the operator image
pypz-python-dev, which inherits from the normal python image and contains amongst more debug symbols
The pypz-python-dev includes GDB already. To be able to step into the code with GDB, you will need to perform the following steps.
Note
For this example a Rancher managed Kubernetes cluster is used i.e., the shell is opened from the Rancher’s GUI. Nevertheless, once you opened the shell by any means (e.g., docker exec), the same process applies.
Open the shell
Get the process id (PID) of the pypz process
ps x
Start GDB with the acquired PID
gdb python <PID>

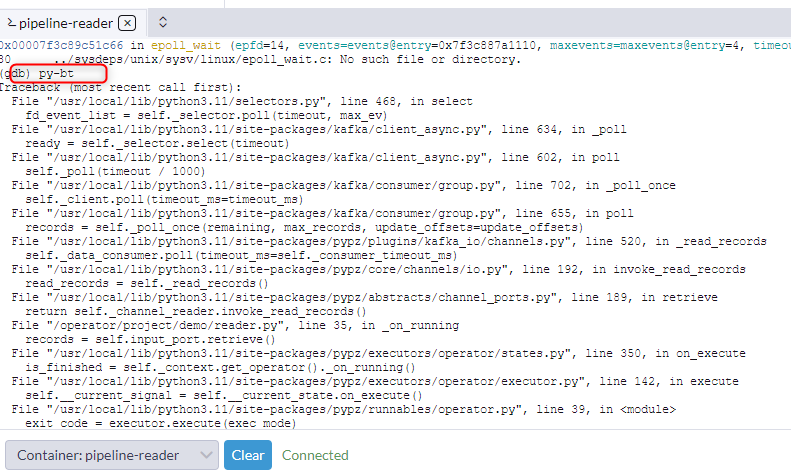
Once you are in GDB, you can invoke the following command to get the call trace
py-bt

You can find more useful commands for GDB in their documentation like continuing and stepping